Skip to content
Enterprise architecture, cloud and data in one model

See your whole architecture. Know what each change costs and breaks.

NovaGraph connects business capabilities, applications, services and infrastructure in one living 3D model. You can trace data lineage, analyse the impact of a change, audit cloud cost and close the gaps.
See how it works
4 linked viewsXS–XL demo modelsColumn-level lineageAzure cost & risk audit
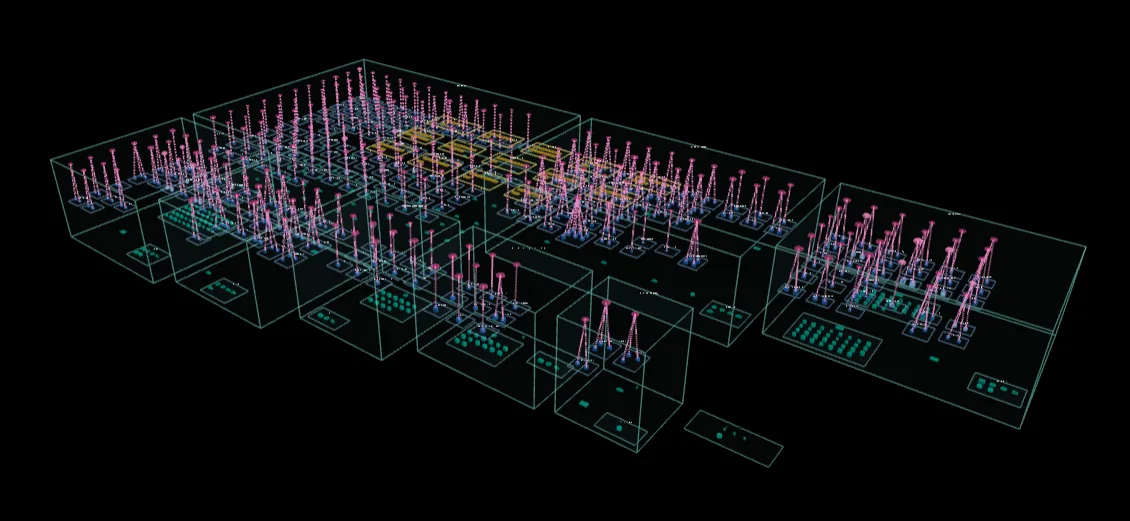
NovaGraph in 3D, Combined / Deployment grouped by site: each site is a glass volume holding its infrastructure in teal, with the business applications it runs in pink and their components in blue above it, and business capabilities in gold.
The product, not a mock-up: Combined / Deployment, grouped by site. Every site holds the applications and components that run there.
The problem

Architecture lives in slides, spreadsheets and people's heads. Then the cloud bill arrives.

Rising cloud costs

Idle VMs, stopped-but-billed machines, unattached disks and forgotten environments keep running. Nobody can say which application they belong to.

Disconnected applications

Hundreds of applications and integrations, each documented differently, or not at all. How data moves between them is tribal knowledge.

Limited visibility

Before a change, nobody can answer what depends on this system, what it runs on and what breaks. So changes are slow, or risky.

The solution

One model, four connected planes, from what the business does down to where it runs.

Every element is a configuration item (CI) with its record. Typed relationships link the planes, so any question can be followed up or down.

The four planes of a NovaGraph model Business capabilities at the top are realised by business applications. Applications contain logical components and services, which exchange data and are hosted on physical infrastructure at the bottom. Capabilities Applications Components Infrastructure realizes ↑contains ↓hosted_on ↓data flows
Business capabilitiesWhat the business does: maintenance, trading, finance. The stable map leaders plan with.
Business applicationsThe systems that realise them, with owner, lifecycle, criticality and cost in each record.
Logical components & servicesAPIs, databases, integrations and data assets, and the data flowing between them.
Physical infrastructureServers, clusters, networks, sites and cloud resources: where everything actually runs.
Views: Logical Software Physical Infrastructure Combined / Deployment Data
Relationships: realizes contains hosted_on runs_on located_in plus data flows and lineage
How it works

Connect what you have. Model it once. Act on it.

01 · CONNECT

Bring in what exists

  • Import a model from CSV, or start from a demo
  • Harvest metadata from PostgreSQL, MySQL, SQL Server and ODBC databases, S3 and ADLS
  • Read an Azure subscription: a CLI snapshot, or live from the server
02 · MODEL

One connected model

  • CIs with records: owner, lifecycle, criticality, cost
  • Relationships across the four planes
  • Data assets, columns and end-to-end lineage
  • A project per team, with its own roles
03 · ACT

Decide and change

  • Impact analysis before every change
  • Cloud audit: cost, usage, security gaps, savings
  • AI review of risks and data gaps
  • Cloud actions: start, stop, delete or commission resources (opt-in, password-confirmed)
What it brings

Answers that used to take weeks of interviews

Monthly cloud cost by environment with possible saving developmentproductiontest $239$86$84 Possible saving $327 of $408 a month

Cloud cost visibility

Read an Azure subscription and see every resource as a CI under its application and environment, with its monthly cost, 14-day usage and findings. Each finding says what to fix and what it saves.

Shown: the built-in sample student subscription (retail-price estimate). The bright part of each bar is the possible saving.
Impact of a change to one system on the systems that depend on it SAP S/4HANAMaintenance agentInvoice matchingData platformReportingIntegration

Dependency impact analysis

Select any system to see what realises it, what it contains, what it runs on and which integrations and applications depend on it. Choose how many steps to trace, and compare the current state with the target.

Column-level data lineage from a source system to the gold layer SAP S/4HANA Integration Bronze Silver Gold work_order.equipment_id Click a column to trace it from source to gold.

Data lineage

Follow any column from its source system through integrations into the warehouse. The data model diagram shows every database's tables, keys and references, from metadata harvested from the database itself.

AI review: the model is analysed and findings come back for people to approve Model AI reviewreads the CIs Risk: no failover for a hub Gap: no technical owner Suggested value: approve?

AI-assisted architecture modeling

An AI review finds critical risks in infrastructure and integrations, and data gaps and contradictions. It can fill in empty fields from evidence in the model. Viewers get analysis only; in suggest mode a person approves each value.

Linked 3D and 2D views

Logical Software, Physical Infrastructure, Combined / Deployment and Data. Group by capability or by site, and filter by line type.

Current, target, transition

Plan the target architecture beside today's, and see what is deprecated and what is planned.

Projects and roles

Separate models per team or subscription. Demo sizes XS to XL, clone any project, and owner, contributor or viewer per project.

Metadata harvesting

Scan application databases and object stores into data assets, columns and view lineage, so the model stays accurate.

AI agents, modelled

Agents are modelled like applications: orchestrator, tools, state store, what they read and change, autonomy and oversight.

Import and export

The whole model as CSV: CIs with records, connections with data flows, relationships. Preview first; nothing is deleted.

Roadmap

What works today, and what is next

● Available now
  • ✓3D architecture model: four planes, four views, current and target states
  • ✓Impact analysis and relationship tracing
  • ✓Data lineage to column level, and data model diagrams per database
  • ✓Azure audit: inventory, cost (actual or estimated), usage and findings, by environment
  • ✓Cloud actions: start, stop, delete, and commission a Linux VM. Off by default; each action confirmed with your password
  • ✓AI data review (needs an Anthropic API key) and modelled AI agents
  • ✓Projects with roles, demo models XS to XL, CSV import and export, metadata harvesting
◌ Planned
  • ○AWS and Google Cloud connectors (Azure first)
  • ○Scheduled cloud scans; today a scan runs on request
  • ○Warehouse mapping: gold-layer lineage on the data model diagram
  • ○More commission templates beyond the Linux VM

Explore a real model in a minute

Sign in and open Tethys Energy, a fictional energy company, from the project menu. It comes in five sizes, from 5 to 250 business applications.